For the project in the Data and Visual Analytics course (CSE6242) of the MS Analytics program at Georgia Tech, our topic of choice was to experiement with data analytics techniques to predict the NBA All-Star selection of the 2020 season. Ever since the course was over, I’ve wanted to fully refactor and productionize the data pipeline and the machine learning models required to automate the prediction process.
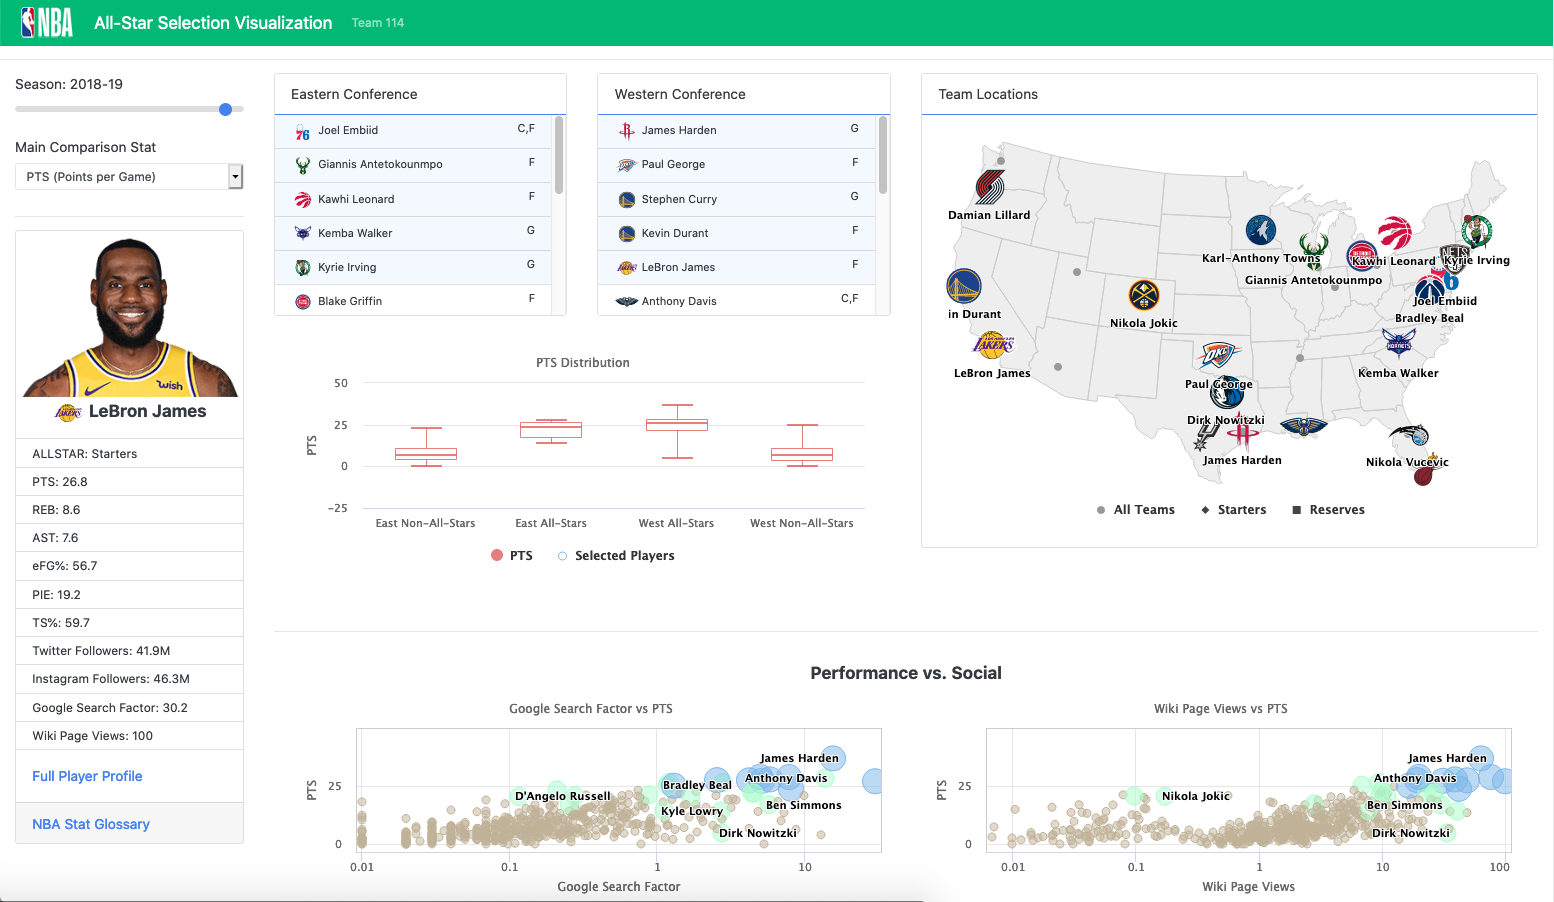
In this first part(0) of a series of posts, it will serve as the summary writeup of the project, including data sets we used to generate the model, approach we took, various model experimentations, and visualization of the results.
Introduction
Our team’s goal is to predict the 2019-2020 season’s NBA All-Star team using a player’s game performance and social presence metrics. All-Star players are top-tier players selected by fans, a media panel, and coaches to participate in a mid-season exhibition game. As such, we hypothesized that a player’s social influence would factor into his likelihood of being voted as an All-Star Starter.
Current models do not account for a player’s social influence. Marketers, NBA fans, or sports bettors may be interested in having fun with the results or using them in marketing activities.
Data Collection
Primary data sets include:
- Player Performance Statistics
- Google Search Trend
- Wikipedia Page View Raw Count
- Twitter Followers Count and Tweet Count
- Instagram Follows Count and Posts Count
All-Star Selection
The game is the Eastern Conference versus the Western Conference. The Eastern and Western conference each has 5 starters and 7 reserves, for a total of 24 all-stars per season.
5 Starters
- Fan vote weighs 50%
- Other 50% split between the media and the current NBA players ballot evenly. Split by positions – front- count: 3 slots, guards: 2 slots
7 Reserves
- All 30 NBA coaches are given a ballot with the ability to the 7 reserve players, including wildcard
Approach
Our approach was to combine the player in-game performance data and social data for each NBA player and test classifications models with different features. We experimented with different algorithms in classifying players into 3 classes: starters, reserves, or neither.
We sorted classification results in descending order based on the probability of a player belonging to each class (starters, reserves, not- all-star) and filled in available slots(3 front court players and 2 guards players) for the top five players with the most starting votes from our random forest model, which gave us the highest accuracy when tested against test data. Whether a starter is a front court player or guard depends on what position he plays in the NBA.
Model Experientation
Given the limited impact of social presence data on choices of all-star reserves, the in-game statistics data were first used for initial experimentation and the prediction of all-star reserves. In-game statistics combined with social presence data is used for the prediction of starters.
Neural Network:
- Python Keras' backpropagation neural network was used with two hidden layers containing 36 nodes each.
- Predicted reasonable All-Stars with using stats but performed poorly with using stats and social data.
Random forest
- Tested combinations of columns with game stats only, stats with Google search trend, wiki page view, and # of social media followers
- Tested various number of trees (10-500) and standardized selected features per season
- The amount of Twitter and Instagram historical data was limiting because there was not enough data (only ~500 rows after mapping to one row per player/season)
Results
The most accurate model is from using Random Forest for Starters prediction. The model comprises of using combined columns with selected performance stats, Google Search Trend Factor, and Wiki page views. Selected performance stats are chosen based on the top features returned by random forests' feature importance function. Two most important features are FP (fantasy points – which itself is based on a formula) and PTS (points per game).
This model achieves ~96% accuracy in 70/30 test split. Specifically for the last 2018-19 season, it was able to predict all 10 All-Stars starters. The reserves prediction was less accurate even though the model achieved an overall ~98% accuracy against 400+ NBA players last season. Due to the highly imbalanced nature of the dataset (24 players out of 300-400 players are all stars), even if the model predicts that no-one is an all-star, it is still going to achieve a 90%+ accuracy if we measure against the entire dataset. So we have to keep that in mind when using accuracy as the basis for evaluating the effectiveness of the model.
Presentation - Web Visualization
An interactive web user interface was created with HighCharts, Vue.js, Bootstrap that displays previous season all-star selections as well as interactions to see details about specific players and distribution of statistics.
